Delaware’s 2022 test scores were released Tuesday, and they aren’t pretty.
Just 30% of Delaware students in grades three to eight met grade level math requirements, while 42% earned a proficient score in English language arts.
These scores come from the state-administered Smarter Balanced Assessment, an end-of-the-year summative test that measures the abilities of students in grades three through eight in math and reading.
Because of the pandemic, there was no testing in 2020, and education officials have expressed concern over the value and accuracy of data in 2021.
Compared to 2019, the last year with a full and complete dataset, Delaware’s reading and math scores plummeted further and they already ranked in the bottom half of the country.
“This is a crisis, there’s no other way around it,” said Laurisa Schutt, executive director of First State Educate, a local education advocacy group.”
The Department of Education also published the state’s SAT scores Tuesday, and they also show a drop, but not as much as the Smart Balanced test.
Test scores release
In 2019, 48% of students scored proficiently in the evidence-based reading and writing portion, 28% tested proficient in math, and 42% reached that mark in the essay portion.
In 2022, the numbers are 47% for the evidence-based reading and writing portion, 24% for math, and 38% for the essay.
“We were using these test results as a baseline for recovery,” said Theresa Bennett, director of the Office of Assessment at the Department of Education.
The subpar scores come even though more than $600 million has been allocated to Delaware education for pandemic relief.
“We’ve never had as many resources in Delaware public education as right now,” said Education Secretary Mark Holodick at a Brandywine School District town hall meeting Monday. “We’re in an amazing position to do great things for kids because we have the resources that we haven’t had before.”
The scores look even worse when broken down by ethnicity, income and special needs, said Liz Parlett Butcher, director of communications for First State Educate.
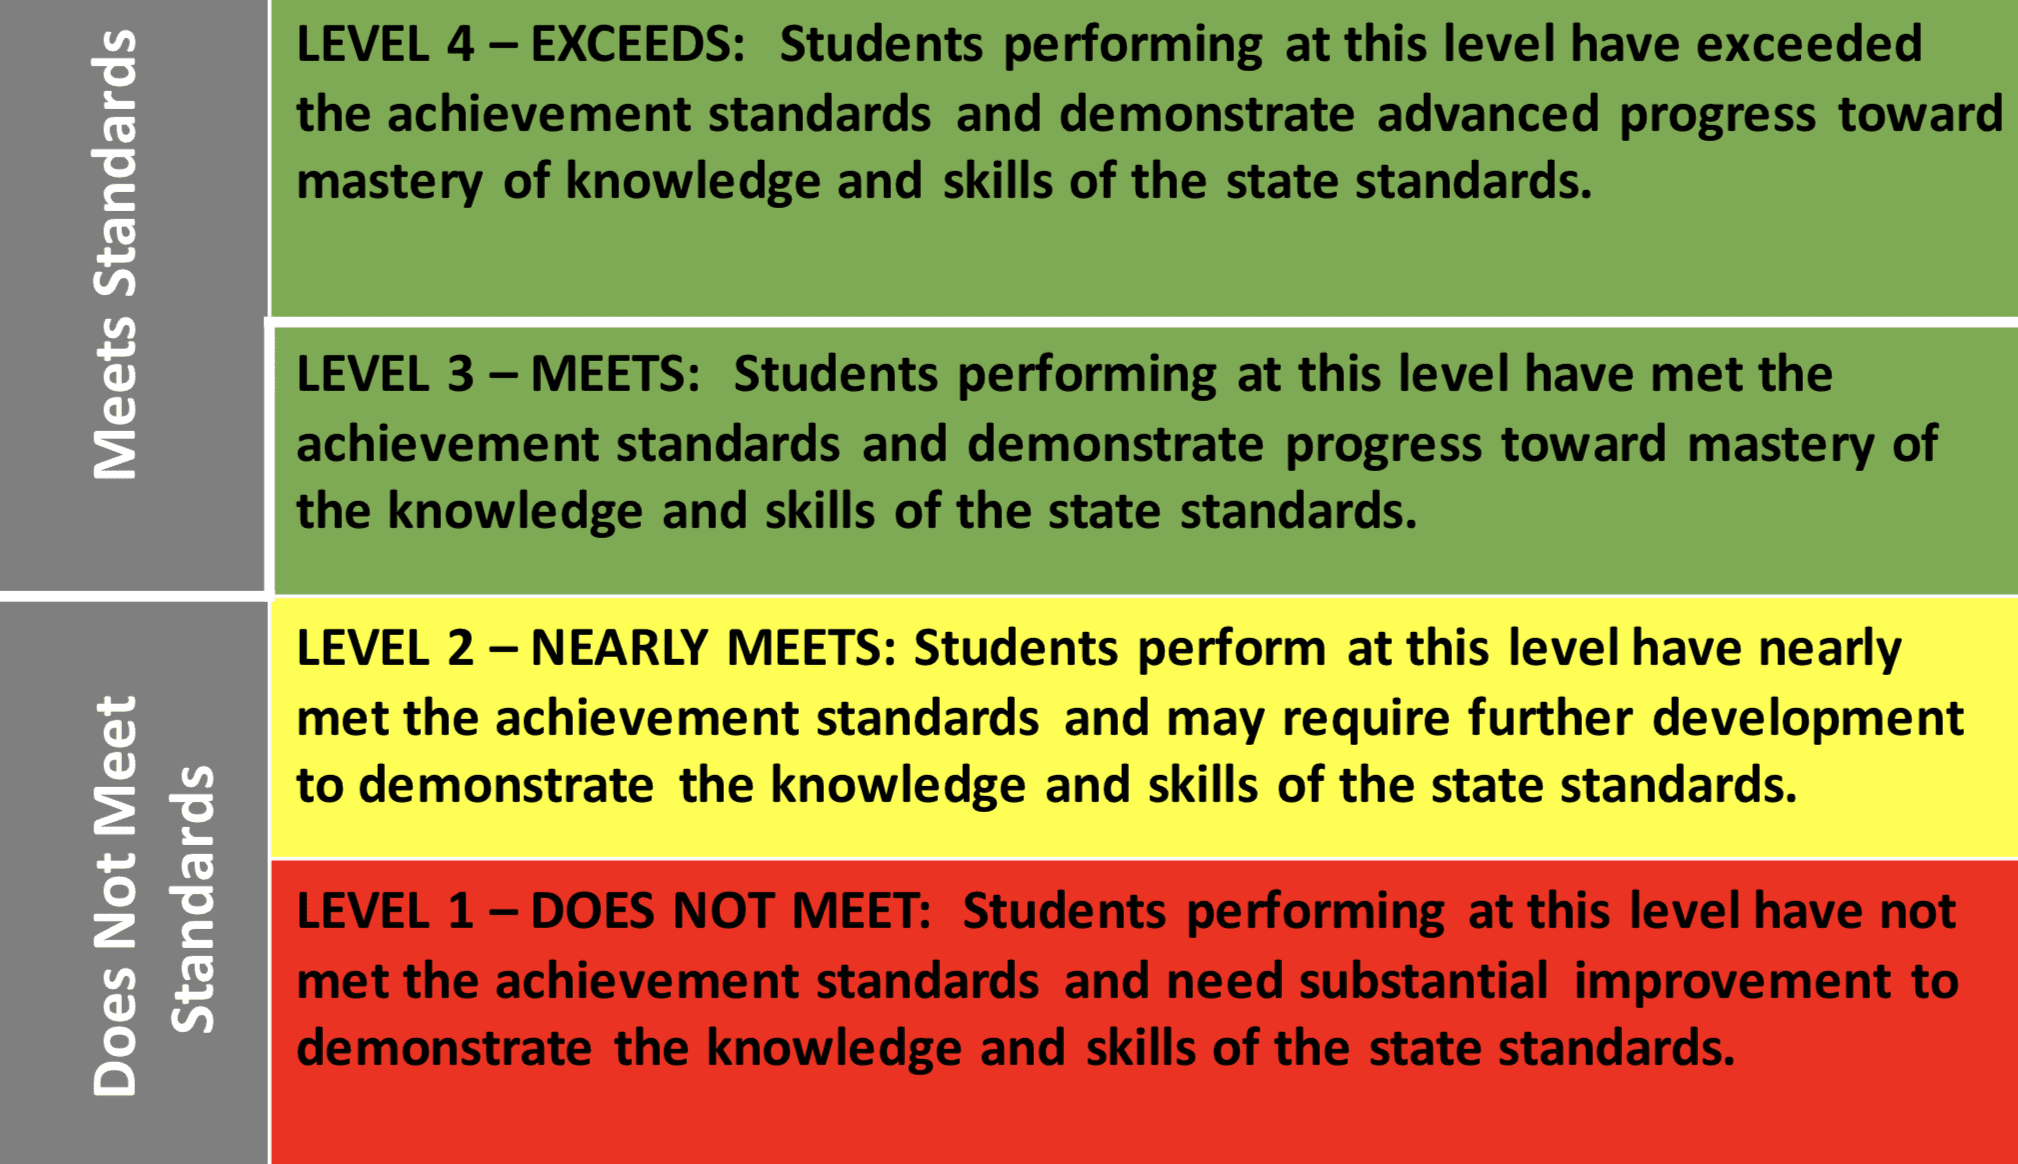
The scores have four achievement levels: 1 means the student does not meet standards, 2 indicates a student nearly meets standards, 3 means the student meets standards and 4 means the student “exceeds standards.”
Vulnerable students struggling
In 2022 on the English Language Arts portion of the Smarter Balanced Assessment, 69% of students with disabilities fell into achievement level 1, as did 50% of low-income students and 56% of English Language Learners.
For the math part of the test, it’s even worse: 76% of students with disabilities scored in the first achievement level, as did 61% of low-income students and 62% of English Language Learners.
The three subgroups struggled even more on the SAT.
For the evidence-based reading and writing part, just 3% of English Language Learners scored proficient, with 8% of students with disabilities and 29% of low-income students doing the same.
The SAT math scores are even lower.
Just 1% of English Language Learners, 2% of students with disabilities, and 10% of low-income students earned a proficient score in the math portion of the SAT.
For the essay part, 3% of English Language Learners, 5% of students with disabilities, and 21% of low-income students scored proficient.
Discrepancies in test scores by ethnicity
Broken down by ethnicity, for the English Language Arts test, 47% of Black students landed in the lowest achievement level, as did 41% of Hispanic students, compared to just 23% of white students in that category.
In math, 60% of Black students were in the lowest achievement level, and 51% of Hispanic students were too, compared to 29% of white students landing here.
The discrepancies in scores by different ethnic backgrounds are also reflected in the SAT scores.
Just 30% of Black students and 32% of Hispanic students scored a proficient score in the evidence-based reading and writing part of the SAT, compared to 61% of white students.
For math, 34% of white students scored proficient, but only 10% of Black students and 13% of Hispanic students did the same.
The scores for social studies and science tests are taken at three points in a student’s career in Delaware.
The social studies test is taken in grades 4, 7, and 11, and the science tests are taken in grades 5 and 8, and whenever the student takes biology in high school.
Similar to the reading, math, and SAT scores, Black students and Hispanic students scored lower across the board than white students, and students with disabilities, English Language Learners, and low-income students continued to struggle.
“Something that we’re just being really cautious about is looking at the demographics and seeing which students are not included in the current dataset,” said DOE’s Bennett. “The kids that were in third grade in 2019 didn’t have the same experiences that the kids in third grade had this past year, you know, and the year before, so we’re trying to take the context into consideration.”
Bennett said that at this point, the Department of Education is really just trying to digest the numbers before offering any analysis.
“Just give us some time because we really do want to dig into this,” she said. “We want to see who’s in the dataset and who’s not in the dataset so that we can do a little bit more analysis on that.”
The Department of Education’s power-point slide includes a set of goals that they now have at the state, district, charter, and classroom levels.
At the state level, the department plans to identify systemic inequities and determine the support and resources needed for student achievement.
At the district and charter level, the department will evaluate the implementation of curriculum and instruction while determining teachers’ professional needs to help them effectively teach.
And in the classroom, the department is set to identify strengths and areas of need while evaluating student achievement in grade-level content.
Schools will be getting some help. Delaware’s 151st General Assembly passed several bills to implement an evidence-based reading curriculum known as the science of reading to try to address the low levels of literacy and test achievement in the state. It also passed a slew of bills to help put mental health counselors and more into schools.
Recommended: Delaware schools to turn to science of reading to improve literacy rates
First State Educate sent out a statement encouraging readers to “Talk now to your school board members, to your school leaders, and to your community members.”
“Act together and ask about our $600,000,000 in federal relief funds, and what changes we hope to see from the investments being made in your district,” the statement said. “Ask how you can volunteer, mentor, read, share, understand and advocate.”
Click here to navigate through the open data portal of test scores.


Raised in Doylestown, Pennsylvania, Jarek earned a B.A. in journalism and a B.A. in political science from Temple University in 2021. After running CNN’s Michael Smerconish’s YouTube channel, Jarek became a reporter for the Bucks County Herald before joining Delaware LIVE News.
Jarek can be reached by email at [email protected] or by phone at (215) 450-9982. Follow him on Twitter @jarekrutz and on LinkedIn
Share this Post


